
Unexplained CPU spikes and steady memory growth are two of the most destructive issues facing modern web applications. Left unaddressed, high CPU consumption leads to thread starvation, elevated request latency, and dropped connections. Simultaneously, unhandled memory leaks trigger severe Garbage Collection (GC) pauses and eventually crash application instances with Out-Of-Memory (OOM) errors.
Learning how to debug high CPU usage and memory leaks in web applications requires a structured, tool-driven diagnostic workflow rather than guesswork. This step-by-step guide walks you through isolation strategies, CPU flame graph profiling, heap snapshot analysis, and preventative runtime practices across popular modern execution environments (Node.js, JVM, Python, and Go).
Key Takeaways
- Separate Compute Bottlenecks from Memory Retention: High CPU usage stems from unoptimized algorithmic complexity, infinite loops, or event-loop blocking, whereas memory leaks occur when unused objects remain referenced and protected from Garbage Collection.
- Master Profile Visualization Tools: Use CPU profiling tools to generate flame graphs that visualize call stack execution time, pinpointing exact functions consuming excessive CPU cycles.
- Capture and Compare Delta Heap Snapshots: Diagnosing memory leaks requires taking baseline heap snapshots and comparing them against post-load snapshots to detect growing object retention paths.
- Monitor Garbage Collection Telemetry: Frequent, long GC pauses often signal underlying memory pressure, where the runtime spends more time attempting to free memory than executing business logic.
Understanding the Difference: High CPU vs. Memory Leaks
Before diving into profiling tools, developers must distinguish between compute-bound and memory-bound degradation.
┌────────────────────────────────────────────────────────────────────────┐
│                   PERFORMANCE DEGRADATION TAXONOMY                     │
├───────────────────────────────┬────────────────────────────────────────┤
│ HIGH CPU USAGE                │ MEMORY LEAKS (OOM RISKS)               │
├───────────────────────────────┼────────────────────────────────────────┤
│ - Synchronous, blocking loops │ - Retained references to dead objects  │
│ - Unoptimized RegEx parsing   │ - Uncleared global event listeners     │
│ - High context-switching      │ - Growing cache maps without eviction  │
│ - Heavy cryptographic work    │ - Unclosed database cursor connections │
└───────────────────────────────┴────────────────────────────────────────┘
Step 1: Diagnosing and Fixing High CPU Usage
High CPU usage occurs when a process monopolizes system processor cycles, preventing the runtime from handling concurrent HTTP requests smoothly.
1. Identify the Offending Process and Thread
Use system-level diagnostic utilities to confirm process IDs (PIDs) and thread-level CPU consumption:
- Linux CLI:
top,htop, orpidstat -u -p <PID> 1 - Process Inspection: Inspect individual worker threads within application runtimes to locate thread starvation.
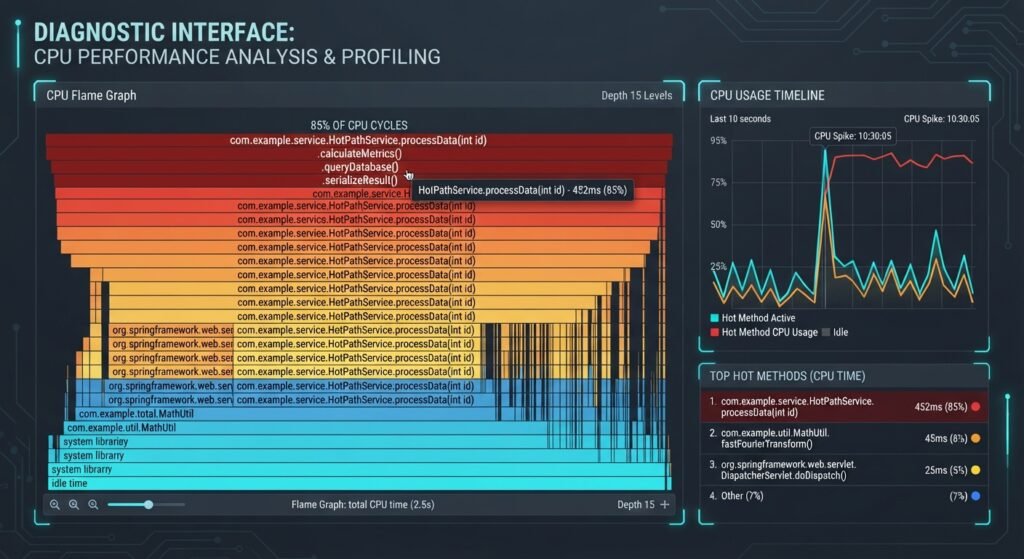
2. Generate CPU Flame Graphs
Flame graphs visualize call stack execution times horizontally, where the width of a box represents the proportion of total CPU time spent executing that specific function.
┌─────────────────────────────────────────────────────────────────────────┐
│                      FLAME GRAPH VISUALIZATION                          │
│                                                                         │
│  [  processRequest()  ]  <-- Caller Stack                           │
│  [    parseJSONData()   ]                                               │
│  [======================= executeRegexMatch() =======================]   │
│  ^ Wide boxes indicate functions consuming significant CPU cycles       │
└─────────────────────────────────────────────────────────────────────────┘
- Node.js: Use
node --profor Chrome DevTools inspect protocol (v8-profiler) to generate.cpuprofilefiles. - Go: Use
pprof(go tool pprof http://localhost:6060/debug/pprof/profile?seconds=30). - JVM (Java/Kotlin): Utilize Async-Profiler or JDK Flight Recorder (JFR) to capture low-overhead execution traces.
3. Common CPU Bottleneck Causes & Solutions
- Catastrophic RegEx Backtracking: Complex Regular Expressions with nested quantifiers can cause exponential evaluation time (O(2n)). Refactor matching logic or use linear-time RegEx engines.
- Synchronous I/O on Event Loops: In asynchronous runtimes like Node.js, running synchronous file system calls or heavy array transformations blocks the single-threaded event loop. Offload CPU-heavy computation to Worker Threads or background queues.
Step 2: Isolating and Resolving Memory Leaks
A memory leak happens when objects that are no longer needed by the application remain reachable from the root object tree, preventing Garbage Collectors from reclaiming memory.
┌─────────────────────────────────────────────────────────────────────────────────┐
│                     MEMORY LEAK DIAGNOSTIC LIFECYCLE                            │
├──────────────┬──────────────────┬──────────────────┬────────────────────────────┤
│ PHASE 1      │ PHASE 2          │ PHASE 3          │ PHASE 4                    │
│ Establish    │ Simulate Traffic │ Take Post-Load   │ Inspect Retainer           │
│ Baseline     │ Load             │ Heap Snapshot    │ Tree Paths                 │
│ Heap State   │                  │ & Compare        │                            │
└──────────────┴──────────────────┴──────────────────┴────────────────────────────┘
1. Take Delta Heap Snapshots
Never analyze a single heap snapshot in isolation. Follow this differential process:
- Trigger a manual Garbage Collection run and take Snapshot A (Baseline).
- Execute synthetic load tests simulating typical user journeys.
- Trigger another manual GC run and take Snapshot B (Post-Load).
- Use snapshot comparison views to sort objects by Delta Count and Retained Size.
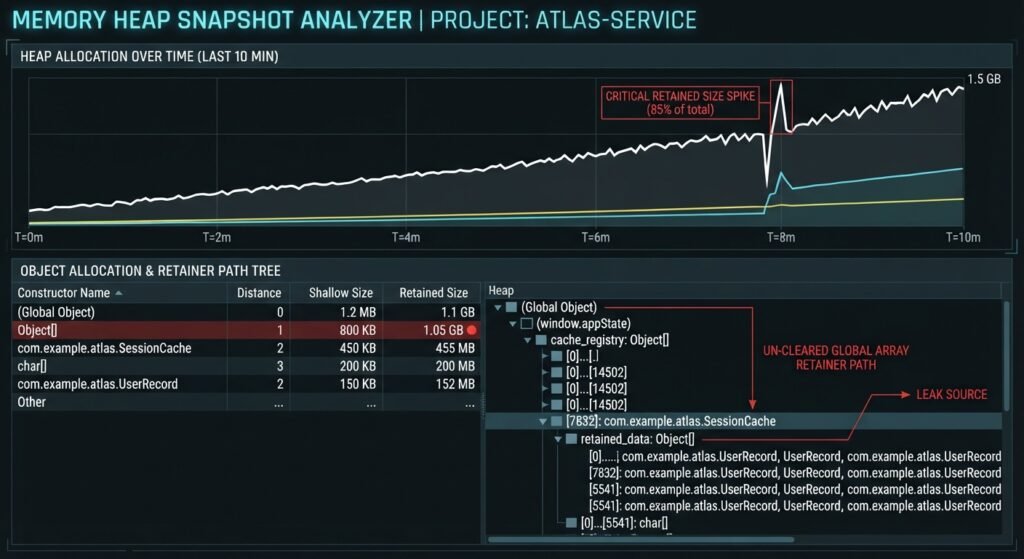
2. Trace Retainer Paths
The Retained Size represents the amount of memory freed once that specific object is garbage collected. Look for large retainer trees held by:
- Unbounded Caches: In-memory objects stored in global maps without Time-To-Live (TTL) or Least Recently Used (LRU) eviction policies.
- Forgotten Event Emitters & Listeners: Subscriptions attached to long-lived global singletons that are never unsubscribed when requests complete.
- Detached DOM Nodes / Closures: Functions keeping outer-scope variables in memory long after the outer function has finished executing.
Production Profiling Best Practices and Guardrails
Executing diagnostic tools in production environments can introduce performance overhead if not managed carefully.
┌─────────────────────────────────────────────────────────────────────────┐
│               PRODUCTION-SAFE PROFILING CHECKLIST                       │
├───────────────────┬─────────────────────────────────────────────────────┤
│ STRATEGY          │ IMPLEMENTATION METHOD                               │
├───────────────────┼─────────────────────────────────────────────────────┤
│ Sampling Profilers│ Use low-overhead sampling profilers rather than     │
│                   │ tracing profilers to limit CPU overhead (<2%).      │
├───────────────────┼─────────────────────────────────────────────────────┤
│ Single-Instance   │ Route profiling sessions to a single isolated pod   │
│ Isolation         │ behind a load balancer canary rule.                 │
├───────────────────┼─────────────────────────────────────────────────────┤
│ Out-of-Process    │ Generate heap dumps out-of-band or offload heap     │
│ Analysis          │ file parsing to offline developer workstations.     │
└───────────────────┴─────────────────────────────────────────────────────┘
For external standards on memory management and diagnostic profiling standards, consult the official Node.js Memory Management and Profiling Guide.
Conclusion
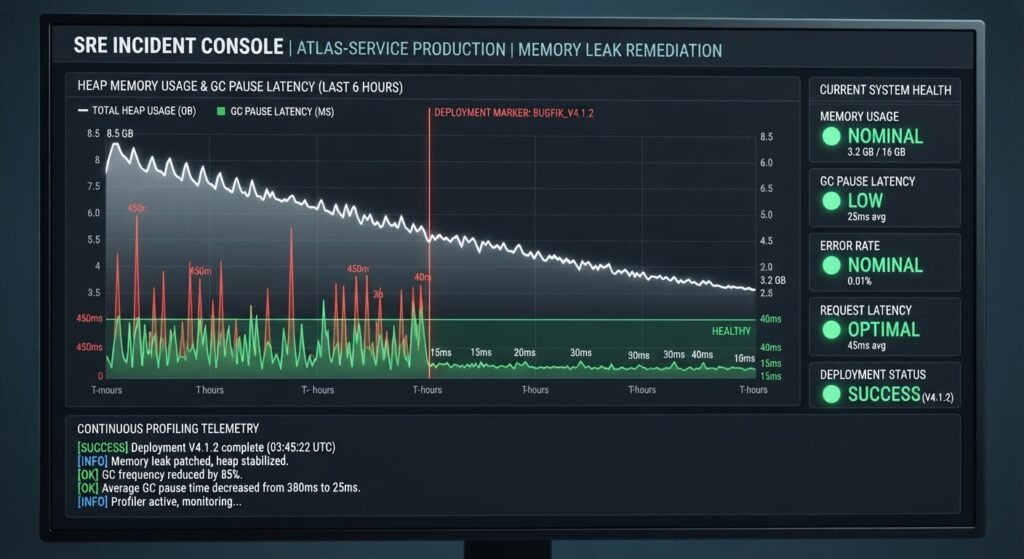
Knowing how to debug high CPU usage and memory leaks in web applications transforms reactive troubleshooting into a systematic engineering discipline. By leveraging CPU flame graphs to identify blocking operations and comparing delta heap snapshots to isolate uncollected retainers, developers can pinpoint root causes quickly. Incorporating low-overhead profiling and continuous telemetry into your delivery pipeline ensures your application maintains high availability, low latency, and efficient resource usage at scale.
Frequently Asked Questions (FAQs)
What is the difference between Shallow Size and Retained Size in heap snapshots?
Shallow Size is the memory allocated directly by the object itself for its own primitive values and structure. Retained Size is the total amount of memory freed when that object is garbage collected, including all child objects held exclusively through its reference chain.
How do I debug high CPU usage in Node.js without crashing production?
Use V8 sampling profilers or built-in inspect flags (node --inspect) attached to an isolated instance or worker thread. Sampling profilers record stack traces at fixed intervals (e.g., every 1 ms), adding minimal overhead (<2-3%) compared to intrusive tracing tools.
Why does garbage collection cause high CPU spikes?
When memory pressure builds due to accumulated uncollected objects, the runtime’s Garbage Collector must work harder to scan, mark, and sweep memory spaces. If available heap space drops too low, the GC runs continuously in a process known as “GC thrashing,” consuming CPU cycles and freezing thread execution.
Would you like a hands-on code example demonstrating how to fix a Node.js memory leak caused by event listeners?Yes
2 thoughts on “How to Debug High CPU Usage and Memory Leaks in Web Applications”