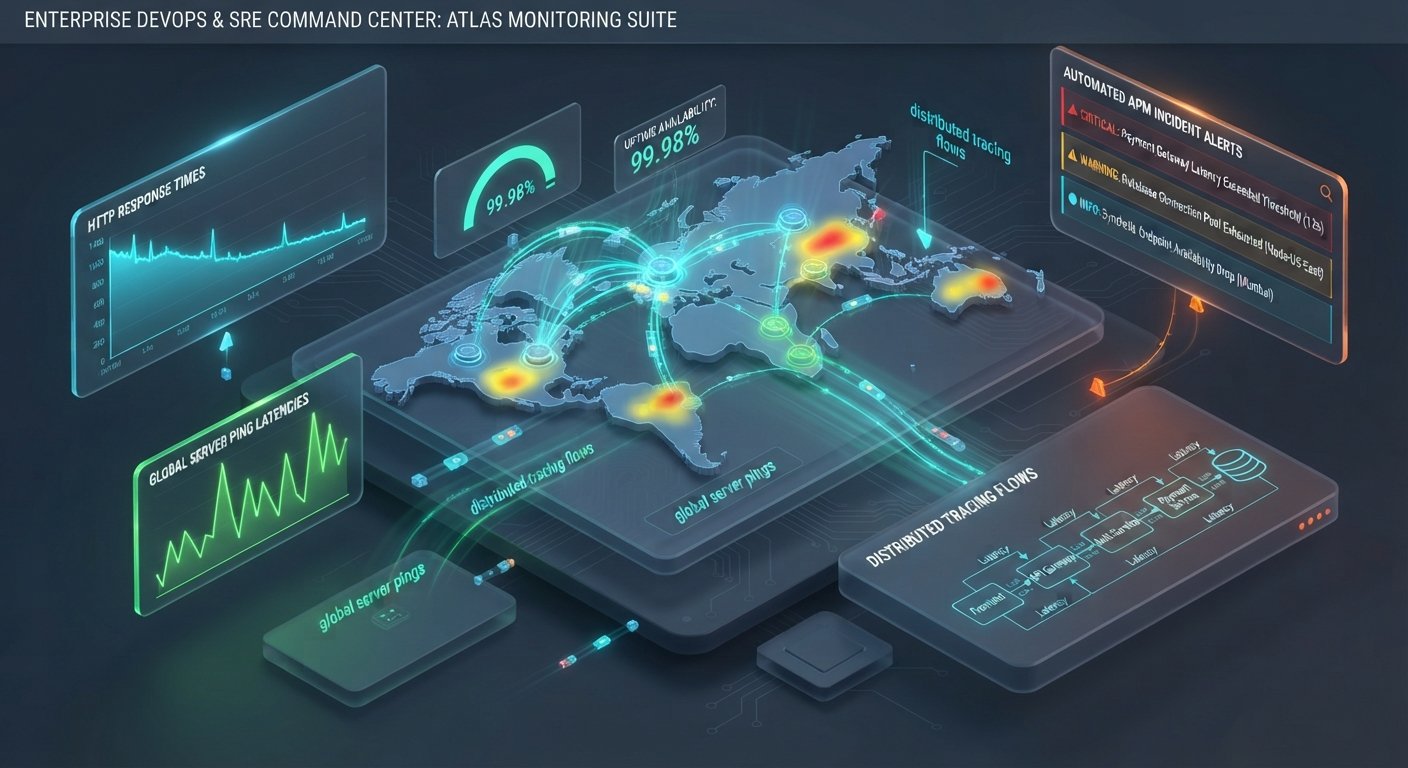
Unplanned downtime and sluggish application performance directly erode customer trust, breach enterprise Service Level Agreements (SLAs), and cause immediate revenue loss for modern cloud platforms. As software architectures shift toward microservices, serverless workloads, and multi-cloud environments, maintaining continuous visibility into digital touchpoints requires modern observability and synthetic monitoring solutions.
Selecting the best SaaS monitoring tools for tracking application uptime and performance involves evaluating synthetic endpoint testing, Real User Monitoring (RUM), distributed tracing, automated incident management, and cost-effective alerting frameworks. This comprehensive guide analyzes top-rated SaaS monitoring platforms, key monitoring paradigms (Synthetic vs. RUM vs. APM), and practical SRE integration strategies to guarantee 99.99% availability.
Key Takeaways
- Uptime vs. APM Granularity: Lightweight uptime monitors (e.g., Better Stack, Pingdom) verify URL availability and SSL validity every 30 seconds, while full-stack APM solutions (e.g., Datadog, Dynatrace) inspect backend code-level bottlenecks, database query latencies, and distributed trace paths.
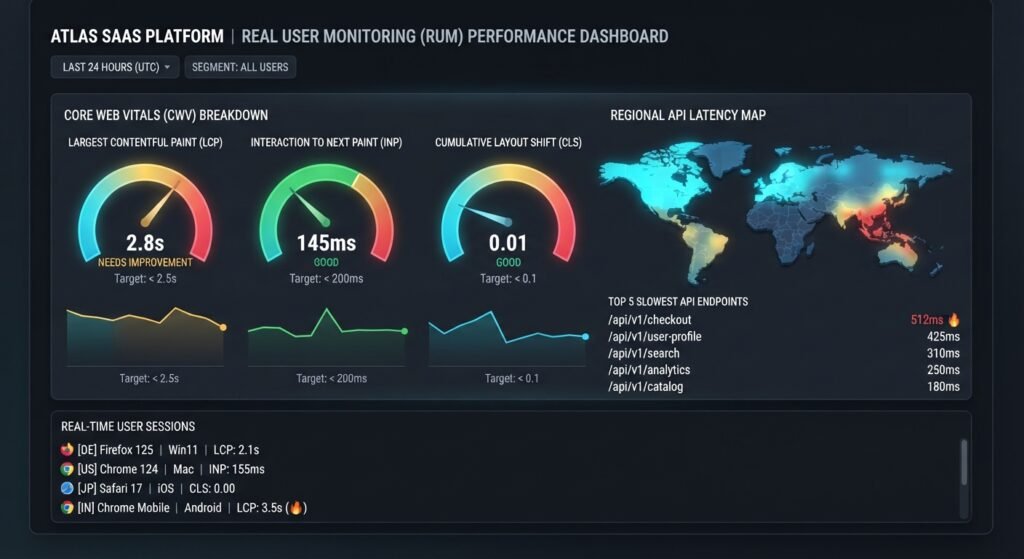
- Synthetic vs. Real User Monitoring (RUM): Synthetic monitoring simulates multi-region user journeys (checkout flows, login forms) to detect outages before customers notice, whereas RUM measures actual page load times and frontend Core Web Vitals across real browsers and devices. Hyperping
- Incident Escalation & On-Call Workflows: Modern monitoring platforms integrate directly with PagerDuty, Slack, and Microsoft Teams to streamline incident triage, reduce alert fatigue, and enforce automated escalation policies. Hyperping
- Cost Predictability at Scale: High-volume log ingestion and trace retention can cause unexpected cloud bills; picking between flat-rate ping tools and usage-based full-stack telemetry platforms depends heavily on engineering team size and infrastructure complexity.
Technical Evaluation Framework for SaaS Monitoring Software
Engineering leaders and DevOps teams should evaluate application monitoring software across five core operational criteria:
┌────────────────────────────────────────────────────────────────────────┐
│             SAAS MONITORING TOOL EVALUATION FRAMEWORK                  │
├───────────────────────────────┬────────────────────────────────────────┤
│ MONITORING METHODOLOGY        │ ALERTING & INCIDENT RESPONSE           │
├───────────────────────────────┼────────────────────────────────────────┤
│ - Synthetic Multi-Region Pings │ - Multi-Channel Alerts (Slack, SMS)    │
│ - Real User Monitoring (RUM)  │ - Smart Escalation & On-Call Schedules │
│ - Distributed APM Tracing     │ - Automated Root-Cause Analysis (AIOps)│
├───────────────────────────────┴────────────────────────────────────────┤
│ SLA GOVERNANCE, INTEGRATION & EFFICIENCY                               │
│ - Low Alert Noise & Dynamic Anomaly Thresholds                         │
│ - Public & Private Status Pages for Customer Trust                     │
│ - Native CI/CD & Cloud Integrations (AWS, GCP, Azure, Kubernetes)     │
└────────────────────────────────────────────────────────────────────────┘
- Check Frequency & Global Probe Network: High-precision uptime tools ping endpoints every 30 to 60 seconds from dozens of global geographical locations to eliminate false positives caused by localized network transit errors.
- Synthetic Transaction Scripting: The ability to execute headless browser tests (e.g., Playwright or Selenium scripts) ensures critical multi-step user workflows remain functional.
- Full-Stack Observability (Metrics, Logs, Traces): Correlating elevated HTTP 5xx error spikes directly to specific SQL queries or microservice API calls drastically reduces Mean Time to Resolution (MTTR).
- Status Page Generation: Hosted public and private status pages automatically reflect live service health, offloading support ticket surges during major cloud incidents.
- Pricing Transparency: Evaluating per-host, per-user, or per-synthetic-check pricing models prevents cost overruns as monitoring scope scales.
Top SaaS Monitoring Tools for Application Uptime and Performance
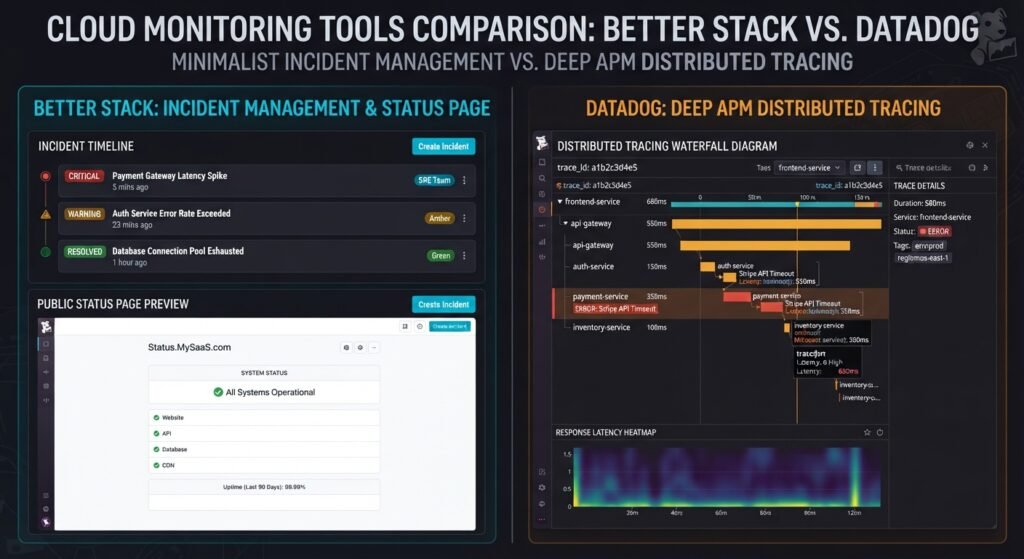
1. Better Stack: Unified Uptime, Incident Management & Logging
Better Stack combines high-frequency uptime monitoring, sleek public status pages, incident management, and high-speed log management into a unified platform.
Hyperping
- Core Strengths: 30-second multi-region uptime checks, built-in on-call scheduling, visual incident timelines, and SQL-compatible log search.
- Best For: Fast-growing engineering teams seeking an all-in-one platform for uptime monitoring, status pages, and incident triage without managing disparate tools.
2. Datadog: Enterprise Cloud-Scale APM & Synthetic Monitoring
Datadog is a dominant observability platform providing end-to-end infrastructure metrics, distributed tracing, RUM, and synthetic browser testing within a single pane of glass.
Fivenines
- Core Strengths: 600+ pre-built cloud integrations, deep microservice dependency mapping, machine learning anomaly detection, and extensive customization. Fivenines
- Best For: Large enterprises and cloud-native organizations operating complex Kubernetes or serverless microservice architectures.
3. New Relic: Full-Stack Telemetry & Performance Analytics
New Relic offers a powerful observability suite featuring Application Performance Monitoring (APM), Real User Monitoring (RUM), and automated root-cause analysis backed by a generous free ingestion tier.
LinuxBlog.io
- Core Strengths: Comprehensive code-level transaction profiling, AI-powered incident correlation, and a flexible telemetry data platform.
- Best For: Software development teams seeking deep backend performance insights and database profiling paired with frontend experience tracking.
4. Site24x7: Cost-Effective All-in-One Infrastructure & Web Monitoring
Backed by Zoho, Site24x7 delivers comprehensive website uptime monitoring, synthetic user journey testing, server performance tracking, and network diagnostics at an accessible price point.
Carmatec
- Core Strengths: Global monitoring coverage from 130+ locations, comprehensive DNS/SSL/TLS validation, synthetic transaction recorders, and affordable tier structures.
- Best For: Small-to-midsize businesses (SMBs) and IT operations teams requiring versatile infrastructure and web monitoring on a predictable budget. Carmatec
5. Dynatrace: AI-Driven Enterprise Observability & Automation
Dynatrace leverages its Davis AI engine to deliver automated root-cause identification, auto-discovery of cloud topologies, and full-stack performance monitoring.
- Core Strengths: Zero-configuration auto-discovery via OneAgent, hyper-accurate anomaly detection, and enterprise governance.
- Best For: Global enterprise organizations running large-scale, multi-cloud enterprise workloads that demand automated root-cause analysis.
To evaluate complementary cloud infrastructure management strategies, explore our guide on the [Best Cloud Cost Optimization Tools for DevOps Teams]([Internal Link: Insert relevant internal URL here with anchor text]).
SaaS Monitoring Feature & Workload Comparison Matrix
| Platform | Primary Focus | Uptime Check Interval | Key Feature | Ideal Team Size |
|---|---|---|---|---|
| Better Stack | Uptime + Logging + On-Call | Down to 30 Seconds | Integrated status pages & on-call escalation | Startups to Mid-Market |
| Datadog | Full-Stack APM & Observability | Flexible (Real-time) | 600+ integrations & distributed tracing | Mid-Market to Enterprise |
| New Relic | Code-Level APM & RUM | Real-time Telemetry | Full-stack telemetry & AI root-cause analysis | Developers & Scale-ups |
| Site24x7 | Web, Server & Network Pings | Down to 1 Minute | 130+ global check locations & synthetic checks | SMBs & IT Operations |
| Dynatrace | Autonomous AI Observability | Continuous Auto-Discovery | Davis AI root-cause causation engine | Global Enterprise |
Strategic Implementation Plan for SRE & DevOps Teams
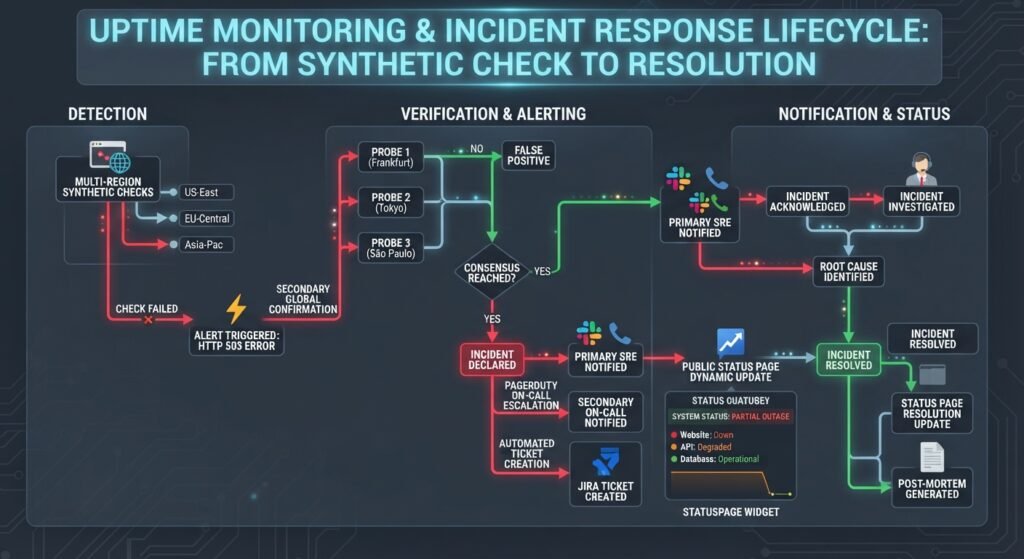
To maximize application availability and eliminate alert fatigue, implement this four-phase monitoring lifecycle:
┌─────────────────────────────────────────────────────────────────────────────────┐
│                    SAAS MONITORING IMPLEMENTATION LIFECYCLE                     │
├──────────────┬──────────────────┬──────────────────┬────────────────────────────┤
│ PHASE 1      │ PHASE 2          │ PHASE 3          │ PHASE 4                    │
│ Define SLOs  │ Deploy Synthetic │ Configure APM    │ Establish On-Call          │
│ & Error      │ & Ping Checks    │ & Distributed    │ Escalations &              │
│ Budgets      │                  │ Tracing          │ Status Pages               │
└──────────────┴──────────────────┴──────────────────┴────────────────────────────┘
- Define Service Level Objectives (SLOs) and Error Budgets: Establish clear availability targets (e.g., 99.9% uptime) and response-time baselines across core endpoints.
- Deploy Multi-Region Synthetic Health Checks: Configure automated pings and browser scripts across multiple continent nodes to verify frontend availability, SSL expiry, and critical API responses.
- Instrument APM for Deep Context: Install lightweight APM agents to trace backend database queries, external API call bottlenecks, and unhandled runtime exceptions.
- Automate On-Call Routing and Status Communication: Connect alert channels to on-call schedules with smart escalation policies and link monitoring state to public status dashboards.
For official guidelines on setting up reliable site reliability metrics and error budgets, consult the official Google Site Reliability Engineering (SRE) Workbook Guide.
Conclusion
Deploying the best SaaS monitoring tools for tracking application uptime and performance is a fundamental requirement for delivering reliable, enterprise-grade software. Lightweight tools like Better Stack and Site24x7 offer immediate value through rapid synthetic ping checks, status pages, and streamlined on-call alerts. Meanwhile, full-stack observability platforms like Datadog, New Relic, and Dynatrace provide the deep code-level tracing and AI-driven insights necessary to diagnose complex microservice failures. By aligning your monitoring stack with team scale and implementing automated incident workflows, you can resolve issues proactively before they impact end-user experience.
Hyperping
Frequently Asked Questions (FAQs)
What is the difference between synthetic monitoring and real user monitoring (RUM)?
Synthetic monitoring uses automated scripts and periodic HTTP pings from global servers to test application availability and user paths proactively. Real User Monitoring (RUM) passively collects performance data from actual human users navigating your live web or mobile application in real time.
How frequently should SaaS monitoring tools check application uptime?
For mission-critical production web applications and APIs, uptime checks should run every 30 to 60 seconds. Intervals longer than 3 to 5 minutes can delay critical incident notifications, increasing your Mean Time to Detect (MTTD) during major cloud outages.
How do modern monitoring tools prevent false-positive downtime alerts?
Top SaaS monitoring platforms prevent false alarms by using multi-region confirmation checks. Before triggering an on-call escalation, the platform verifies an endpoint failure across multiple independent global locations to ensure the issue is not a temporary local network glitch.
1 thought on “Best SaaS Monitoring Tools for Tracking Application Uptime and Performance”